News - Новости
January, 18
Analisys of Satellite Images I
have been asked whether a marked dot captured by the geostationary
Earth monitoring satellite GOES 13 could have been Phobos-Grount during
reenter into atmosphere. To
investigate the satellite image (Figure 1), I have used my 3D
tracking software to generate the view of Earth and Phobos as
would have been captured from the GOES 13 satellite at 17.45 UTC (15
January 2012). The result of the simulation is shown in Figure 2 (on
the right, below): Phobos is visible close to the southern hemisphere.
Eventually, to relate the two images I superimposed the whole picture
taken from the satellite, after the adjustment of the scale
distortions, with the simulation. The result of the superimposition is
shown in Figure 4: the simulated view perfectly matches the photo taken
from the satellite, however, the actual Phobos position is very far
from the suspected dot, which represents, therefore, just clouds.
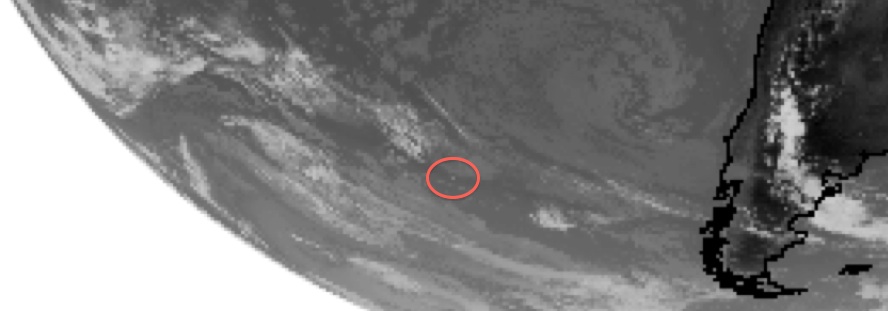 Figure 1, on top, the red circle identifies the dot that was suspected to be phobos-grunt during reenter into atmosphere. Figure 2, on the right, the simulated view of Earth and Phobos (white dot) as seen from the geostationary satellite GOES 13. | 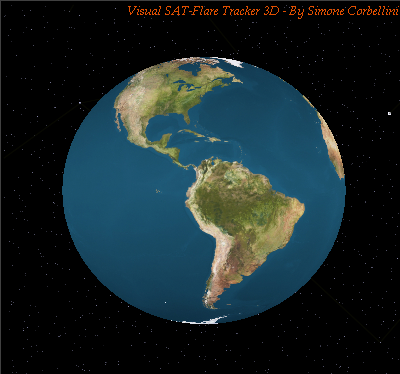 |
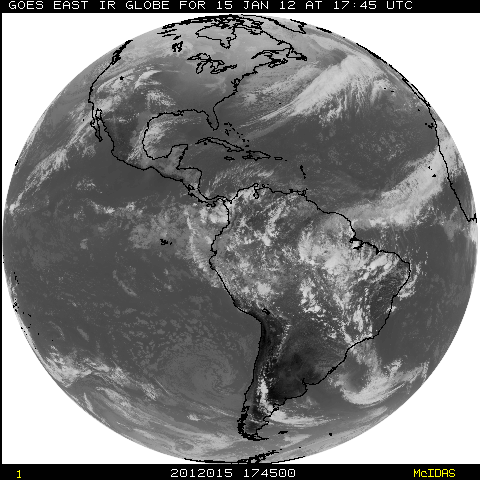
Figure 3 - Original photograph taken by GOES 13 at 17.45 UTC.
Figure 4 - Superimposition of simulated view of Phobos and Satellite photograph: the suspected dot can not be Phobos-Grunt.
January, 3-15
Decay Predictions, Reentry Ground
Tracks and Current State
(up to Jan 15, 18:49 UTC)
(up to Jan 15, 18:49 UTC)
| Source | Date of
Prediction (UTC) |
Predicted decay date (UTC) |
View Related Ground
Tracks (*Note) |
| USSTRATCOM | January 14, 20:30 | January 15, 17:20 (± 2 h) |
View Reentry Track |
| Russian Federal Space Agency | January 15, 16:15 |
January 15, 18:12 (± 22 min) | View Reentry Track |
| Aerospace Corporation | January 15, 16:35 |
January 15, 17:52 (± 19 min) | View Reentry Track |
| Calsky.com | January 15, 17:24 | January 15, 19:54 (± 0.7 h) |
View Reentry Track |
| Ted Molczan | January 15, 09:21 |
January 15, 20:07 (± 2.5 h) January 15, 16:37 (± 2.5 h) |
View Reentry Track View Reentry Track |
| Harro Zimmer | January 15, 17:55 |
January 15, 18:02 (± 12 min) | View Reentry Track |
| Paul Salanitri | January 15, 13:34 | January 15, 17:30 (± 3 h) |
View Reentry Track |
| Abdolreza Lavari | January 14, 20:15 | January 15, 17:30 (± 1.5 h) |
View Reentry Track |
TABLE I - DECAY
PREDICTIONS
*Note. The
current uncertainty of the re-enter time is still too large to identify
the geographical region of reenter, however, it is already possible to
estimate the bands around the planet that may be involved according
to the available predictions. As the re-enter time approaches
these bands may shift; click on the last column of the previous table
to see them.
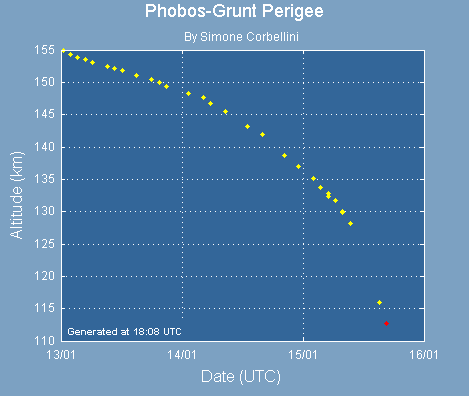
Evolution of Predicted Decay Date

The predicted day of decay according to the SatEvo program is around January 16.
Perigee
and
apogee heights extracted from the available TLEs


 |
 |
December, 10
I
received information (from a non official source) on the attitude
control suggesting
that PhG might be designed to control only one axis in Earth
orbit. I don't know if this is the case, however,
one-axis control
could explain the changes in
brightness that have been recently observed, leaving the
satellite free of
"tumbling" even if it is pointing towards the Sun. Therefore, I studied
all the reported
flares supposing that the attitude control is operative and
PhG
maintains its longitudinal axis pointed towards the Sun. For each of
them I oriented PhG towards the Sun computing surface tilt and angle
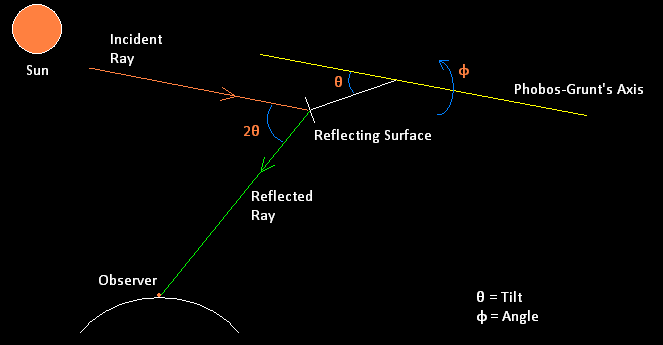
that satisfy the observation (see the picture below for an explanation
of these values). The results are very interesting: five of
ten reported flares would be
generated by the same surface with tilt of 55 +- 1 degrees (which could
be one of the solar panels not fully deployed). The other
five flares
would be generated by a second surfaces with tilt of 65 +- 2 degrees.
If
these results will be supported by new observations they can prove that
PhG is still keeping itself oriented towards the Sun with accuracy
better than 1-2 degrees. The following tables collect all the analyzed
flares with the resulting angles.
High resolution photos taken by Ralf Vandebergh on November 29 and December 28 may help to identify the flaring surfaces and orientation. (Click here to see these photos)
CLASS I - Flares (surface I at 55 degrees)High resolution photos taken by Ralf Vandebergh on November 29 and December 28 may help to identify the flaring surfaces and orientation. (Click here to see these photos)
Schematic representation of
Phobos-grunt flares with the involved angles. Tilt can
be easily computed
as 0.5 x Angle(Sun-Satellite-Observer)
as 0.5 x Angle(Sun-Satellite-Observer)
| N# | Observer | Latitude (deg. N) |
Longitude (deg. E) |
Employed TLE |
Flare Magnitude |
Time
of Observed Flare (UTC) |
JD | Angle (Ф) (deg) |
Tilt (θ)
(deg) |
Tilt Sensitivity (deg/s) |
| 1 | Brad Young | 36.1397 | -95.9838 | 11344.042 | -2 | 10 Dec 00:06:08 | 2455905.5042594 | -66.75 |
56.2 | -0.29 |
| 2 | S. Corbellini | 45.483 | 8.558 | 11340.813 | 0 | 06 Dec 17:01:38 | 2455902.2094677 | -144.26 |
54.3 | -0.46 |
| 3 | S. Corbellini | 45.45 | 8.63 | 11341.559 | 1 | 07 Dec 16:53:45 | 2455903.2039932 | -97.64 |
55.6 | -0.45 |
| 4 | A. Repnoj | 48.6657 | 33.1137 | 11341.559 | 2.5 | 07 Dec 15:24:45 | 2455903.1421876 | -68.19 |
54.6 | -0.23 |
| 5 | S. Kitaev. | 52.617 | 39.6 | 11336.462 | 0.5 | 02 Dec 14:28:27 | 2455898.1030904 | -128.25 |
56.0 | -0.59 |
CLASS II - Flares (surface II at 65 degrees)
| N# | Observer | Latitude (deg. N) |
Longitude (deg. E) |
Employed TLE |
Flare Magnitude |
Time
of Observed Flare (UTC) |
JD | Angle (Ф) (deg) |
Tilt (θ)
(deg) |
Tilt Sensitivity (deg/s) |
| 6 | A. Repnoj | 48.6657 | 33.1137 | 11341.559 | 3.5 | 07 Dec 15:23:45 | 2455903.1414932 | -96.05 | 69.8 | -0.23 |
| 7 | A. Repnoj | 48.6657 | 33.1137 | 11339.633 | 0 | 05 Dec 15:39:41 | 2455901.1525580 | -121.31 | 65.3 | -0.28 |
| 8 | A. Repnoj | 48.6657 | 33.1137 | 11336.836 | 2.5 | 02 Dec 15:59:29 | 2455898.1663080 | -184.13 | 65.3 | -0.10 |
| 9 | Brad Young | 36.1397 | -95.9838 | 11345.035 | 0 | 10 Dec 23:56:18 | 2455906.4974307 | -67.01 | 66.7 | -0.25 |
| 10* | Kevin Fetter | 44.6062 | -75.691 | 11343.111 | 2 | 8 Dec 22:44:01 | 2455904.4472339 | -73.83 | 64.2 | -0.24 |
This figure depicts all the surface angles reported in the previous tables.
A 3D Stereographic Represention of Phobos-Grunt Orientation During a Flare
3D Stereographic pictures of Phobos-Grunt orientation at the Flare #5 of Class I, which has been observed by S. Kitaev on
December 2 at 14:28:27 UTC. These 3D Stereo pictures can be seen crossing the eyes at about half a meter from the screen.
(The orange line represents the Sun-satellite direction. The white segments represent the reflecting surface normal rotated along
the satellite axis. The green lines represent the reflected ray that generates the flare for each surface normal)
An example showing that Phobos-Grunt keeps orientation towards the Sun
Let
us consider two flares: the oldest one and the first one reported in
class 1 (generated by the surface titled 55 degrees). The oldest
observation is dated 2 December whilst the last one 10 December, thus,
more than one week later. Let us now suppose that on the 2nd of
December the satellite was correctly oriented towards the Sun
(declination -21.9 deg. and right ascension 256.5
deg) but
since then the satellite stopped changing its axis and
maintained
this orientation up to December 10 when Brad Young observed the flare.
In this case, the surface tilt to satisfy Brad's
observation should have been of 41.1
degrees,
which is a completely different value for class 1 (or, if you want to
keep the surface at 55 degrees the flare should have been observed at
00:05:48, which is 20 seconds earlier).
November, 25
The best time for attempting to communicate with the spacecraft
It is not clear whether the
space-craft still
keeps itselft oriented to the sun or not. It is not clear also
what happened on November 21 when the perigee ceased to rise and the
spacecraft began to behave like a passive satellite. Among the
possible causes one might simply think that batteries discharged. In
such low earth orbit the power available from the solar panels
is
only 60% since the spacecraft is often in Earth shadow. Despite on Mars
the available power is also of about 50% due to the greater
distance from the Sun with respect to the Earth distance, this might
not be foreseen for the early stage of the mission. In that case I
would focus the attention on December 13 and December 14 when, due to
the orbit precession, the spacecraft will be constantly sunlit.
For the first time since the launch, thanks to the orbit precession, the spacecraft's solar panels will be constantly exposed to sun (100%) over 2 days from December 13 (about 19 UTC) to December 14 (about 20 UTC). |
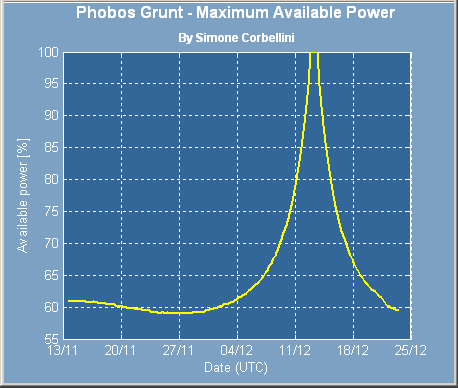
This figure shows the maximum power available from the solar panels. Due to the Earth shadow the mean value is only of about 60%, however, during December 13 and December 14, the spacecraft will be constantly sunlit and this value reaches the 100%.
November, 13
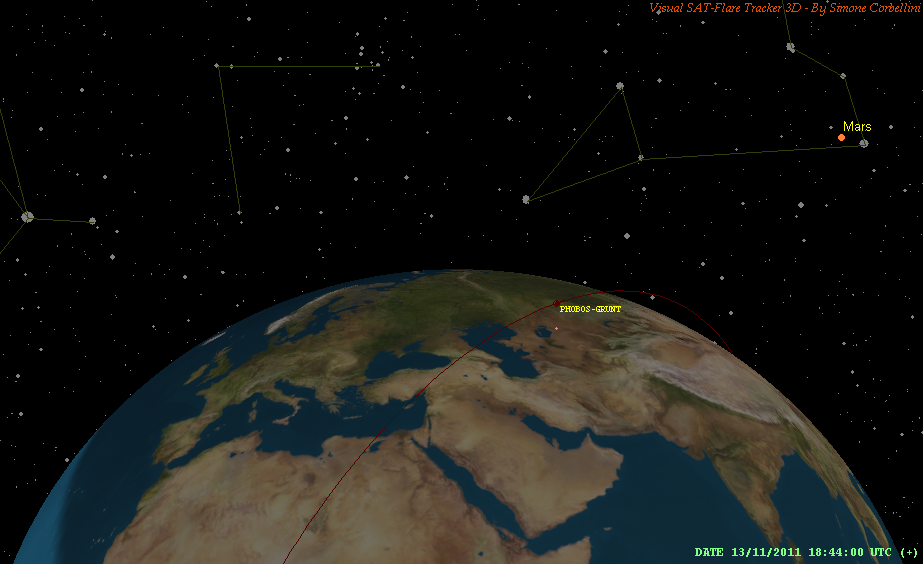
A 3D representation of Phobos'
Orbit and Mars Position
A
3D picture of the Phobos-Grunt orbit on November 13 generated
with the Visual
SAT-Flare Tracker 3D
program. The
orbital plane was still quite aligned with the planet Mars in the
constellation of Leo, but it is slowly precessing toward the
constellation of Cancer. Also the correct alignment between Earth and
Mars is slowly vanishing.
Оbserve Phobos Grunt
Оbserve Phobos Grunt
To see
the spacecraft trajectory in
your sky follow these simple steps:
1) Double click on the map at your location to set your coordinates. Zoom in the map as much as possible to increase the accuracy.
2) Click on the button "Predict Passes" to generate the list of visible passes from your location.
3) Click in the "Rise Time" column for each visible pass. The program will show you the satellite position at the beginning of the pass.
4) Click on the "Draw Sky Chart" button to see the satellite track in your sky.
5) Change the time with the keys s or m (lower case) to increase the time by 1 second or 1 minute (upper case decreases).
See the value of magnitude in the program panel for knowing as bright the satellite will be.Visibility depends on your sky conditions, however, for values less than 4 the satellite is usually visible with the naked-eye. Greater values require binoculars (up to mag. 8 or more) or telescope.
To see where the spacecraft is in real time click on the "Real Time Tracking" button
Фобос
Грунт - Наблюдение
Чтобы увидеть траекторию прохождения
зонда в небе, необходимо:
1) Два раза кликнуть по точке на карте, где вы находитесь, чтобы настроить ваши координаты (увеличиваете карту).
2) Один клик по кнопке "Predict Passes", чтобы найти, когда зонд будет виден у вас
3) Один клик на время в "Rise Time", позволит увидеть, где будет зонд в начале траектории
4) Один клик по кнопке "Draw Sky Chart", чтобы видеть траекторию в небе между звездами
5) Можете изменять время с буквами s или m
Если хотите увидеть, где зонд в режиме реальное время - один клик по кнопке "Real Time Tracking"
